BDA PEER MENTOR
KLH PEER MENTOR BLOG

BIG DATA ANALYTICS
Big data analytics is the often complex process of examining big data to uncover information -- such as hidden patterns, correlations, market trends and customer preferences -- that can help organizations make informed business decisions.
On a broad scale, data analytics technologies and techniques give organizations a way to analyze data sets and gather new information. Business intelligence (BI) queries answer basic questions about business operations and performance.
Big data analytics is a form of advanced analytics, which involve complex applications with elements such as predictive models, statistical algorithms and what-if analysis powered by analytics systems.
Big Data Characteristics
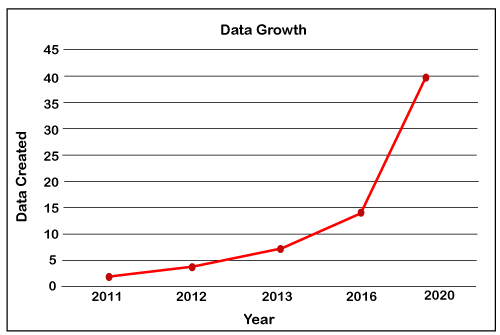
Big Data contains a large amount of data that is not being processed by traditional data storage or the processing unit. It is used by many multinational companies to process the data and business of many organizations. The data flow would exceed 150 exabytes per day before replication.
There are five v's of Big Data that explains the characteristics.
5 V's of Big Data
- Volume
- Veracity
- Variety
- Value
- Velocity
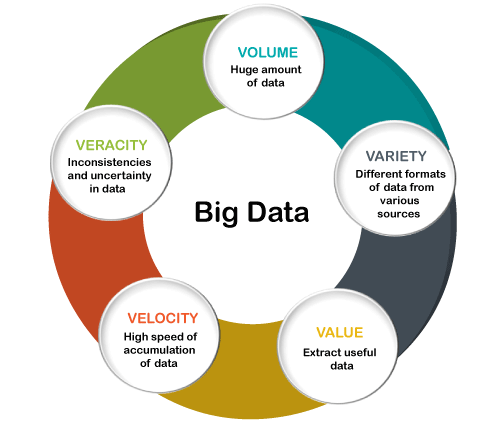
Volume
The name Big Data itself is related to an enormous size. Big Data is a vast 'volumes' of data generated from many sources daily, such as business processes, machines, social media platforms, networks, human interactions, and many more.
Facebook can generate approximately a billion messages, 4.5 billion times that the "Like" button is recorded, and more than 350 million new posts are uploaded each day. Big data technologies can handle large amounts of data.
Variety
Big Data can be structured, unstructured, and semi-structured that are being collected from different sources. Data will only be collected from databases and sheets in the past, But these days the data will comes in array forms, that are PDFs, Emails, audios, SM posts, photos, videos, etc.
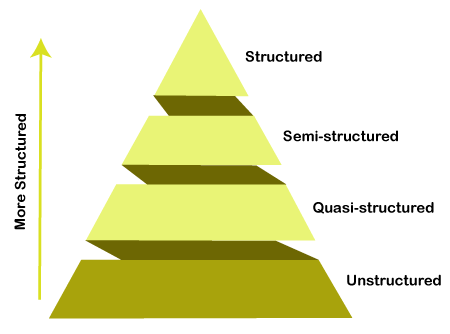
The data is categorized as below:
- Structured data: In Structured schema, along with all the required columns. It is in a tabular form. Structured Data is stored in the relational database management system.
- Semi-structured: In Semi-structured, the schema is not appropriately defined, e.g., JSON, XML, CSV, TSV, and email. OLTP (Online Transaction Processing) systems are built to work with semi-structured data. It is stored in relations, i.e., tables.
- Unstructured Data: All the unstructured files, log files, audio files, and image files are included in the unstructured data. Some organizations have much data available, but they did not know how to derive the value of data since the data is raw.
- Quasi-structured Data:The data format contains textual data with inconsistent data formats that are formatted with effort and time with some tools.
Example: Web server logs, i.e., the log file is created and maintained by some server that contains a list of activities.
Veracity
Veracity means how much the data is reliable. It has many ways to filter or translate the data. Veracity is the process of being able to handle and manage data efficiently. Big Data is also essential in business development.
For example, Facebook posts with hashtags.
Value
Value is an essential characteristic of big data. It is not the data that we process or store. It is valuable and reliable data that we store, process, and also analyze.
Velocity
Velocity plays an important role compared to others. Velocity creates the speed by which the data is created in real-time. It contains the linking of incoming data sets speeds, rate of change, and activity bursts. The primary aspect of Big Data is to provide demanding data rapidly.
Big data velocity deals with the speed at the data flows from sources like application logs, business processes, networks, and social media sites, sensors, mobile devices, etc.
Difference Between Data Science and Business Intelligence
Data Science:
Data science is basically a field in which information and knowledge are extracted from the data by using various scientific methods, algorithms, and processes. It can thus be defined as a combination of various mathematical tools, algorithms, statistics, and machine learning techniques which are thus used to find the hidden patterns and insights from the data which helps in the decision making process. Data science deals with both structured as well as unstructured data. It is related to both data mining and big data. Data science involves studying the historic trends and thus using its conclusions to redefine present trends and also predict future trends.
Business Intelligence:
Business intelligence(BI) is basically a set of technologies, applications, and processes that are used by enterprises for business data analysis. It is basically used for the conversion of raw data into meaningful information which is thus used for business decision making and profitable actions. It deals with the analysis of structured and sometimes unstructured data which paves the way for new and profitable business opportunities. It supports decision making based on facts rather than assumption-based decision making. Thus it has a direct impact on the business decisions of an enterprise. Business intelligence tools enhance the chances of an enterprise to enter a new market as well as help in studying the impact of marketing efforts.
Data Science vs. Business Intelligence (BI)
It is important to begin with some basic definitions of the two terms, taking a deeper look at the two distinct (though closely allied) fields within data analytics. Data Science, as used in business, is intrinsically data-driven, where many interdisciplinary sciences are applied together to extract meaning and insights from available business data, which is typically large and complex. On the other hand, Business Intelligence or BI helps monitor the current state of business data to understand the historical performance of a business.
So, in nutshell, while BI helps interpret past data, Data Science can analyze the past data (trends or patterns) to make future predictions. BI is mainly used for reporting or descriptive analytics; whereas Data Science is more used for predictive analytics or prescriptive analytics.
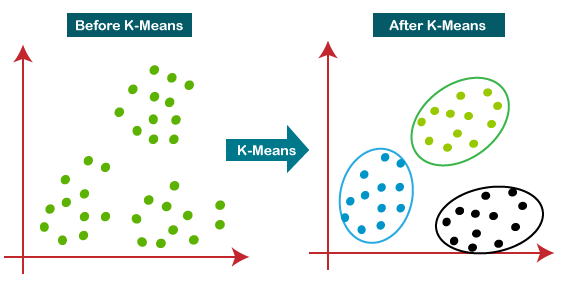
K-Means Clustering
It allows us to cluster the data into different groups and a convenient way to discover the categories of groups in the unlabeled dataset on its own without the need for any training.
It is a centroid-based algorithm, where each cluster is associated with a centroid. The main aim of this algorithm is to minimize the sum of distances between the data point and their corresponding clusters.
The algorithm takes the unlabeled dataset as input, divides the dataset into k-number of clusters, and repeats the process until it does not find the best clusters. The value of k should be predetermined in this algorithm.
The k-means clustering algorithm mainly performs two tasks:
- Determines the best value for K center points or centroids by an iterative process.
- Assigns each data point to its closest k-center. Those data points which are near to the particular k-center, create a cluster.
Hence each cluster has datapoints with some commonalities, and it is away from other clusters.
The below diagram explains the working of the K-means Clustering Algorithm:
Association Rule Mining
Association rule mining finds interesting associations and relationships among large sets of data items. This rule shows how frequently a itemset occurs in a transaction. A typical example is Market Based Analysis.
Market Based Analysis is one of the key techniques used by large relations to show associations between items.It allows retailers to identify relationships between the items that people buy together frequently.
Given a set of transactions, we can find rules that will predict the occurrence of an item based on the occurrences of other items in the transaction.
| TID | Items |
|---|---|
| 1 | Bread, Milk |
| 2 | Bread, Diaper, Beer, Eggs |
| 3 | Milk, Diaper, Beer, Coke |
| 4 | Bread, Milk, Diaper, Beer |
| 5 | Bread, Milk, Diaper, Coke |
Before we start defining the rule, let us first see the basic definitions.
Support Count( ) – Frequency of occurrence of a itemset.
Here
Frequent Itemset – An itemset whose support is greater than or equal to minsup threshold.
Association Rule – An implication expression of the form X -> Y, where X and Y are any 2 itemsets.
Example: {Milk, Diaper}->{Beer} The Association rule is very useful in analyzing datasets. The data is collected using bar-code scanners in supermarkets. Such databases consists of a large number of transaction records which list all items bought by a customer on a single purchase. So the manager could know if certain groups of items are consistently purchased together and use this data for adjusting store layouts, cross-selling, promotions based on statistics.Naive Bayes Classifiers
Naive Bayes is a probabilistic technique for constructing classifiers. The characteristic assumption of the naive Bayes classifier is to consider that the value of a particular feature is independent of the value of any other feature, given the class variable.
Despite the oversimplified assumptions mentioned previously, naive Bayes classifiers have good results in complex real-world situations. An advantage of naive Bayes is that it only requires a small amount of training data to estimate the parameters necessary for classification and that the classifier can be trained incrementally.
Naive Bayes is a conditional probability model: given a problem instance to be classified, represented by a vector x = (x1, …, xn) representing some n features (independent variables), it assigns to this instance probabilities for each of K possible outcomes or classes.
The problem with the above formulation is that if the number of features n is large or if a feature can take on a large number of values, then basing such a model on probability tables is infeasible. We therefore reformulate the model to make it simpler. Using Bayes theorem, the conditional probability can be decomposed as −
This means that under the above independence assumptions, the conditional distribution over the class variable C is −
where the evidence Z = p(x) is a scaling factor dependent only on x1, …, xn, that is a constant if the values of the feature variables are known. One common rule is to pick the hypothesis that is most probable; this is known as the maximum a posteriori or MAP decision rule. The corresponding classifier, a Bayes classifier, is the function that assigns a class label for some k as follows −
MapReduce in Hadoop
MapReduce is a programming paradigm that enables massive scalability across hundreds or thousands of servers in a Hadoop cluster. As the processing component, MapReduce is the heart of Apache Hadoop. The term "MapReduce" refers to two separate and distinct tasks that Hadoop programs perform. The first is the map job, which takes a set of data and converts it into another set of data, where individual elements are broken down into tuples (key/value pairs).
The reduce job takes the output from a map as input and combines those data tuples into a smaller set of tuples. As the sequence of the name MapReduce implies, the reduce job is always performed after the map job.
MapReduce programming offers several benefits to help you gain valuable insights from your big data:
- Scalability. Businesses can process petabytes of data stored in the Hadoop Distributed File System (HDFS).
- Flexibility. Hadoop enables easier access to multiple sources of data and multiple types of data.
- Speed. With parallel processing and minimal data movement, Hadoop offers fast processing of massive amounts of data.
- Simple. Developers can write code in a choice of languages, including Java, C++ and Python.
An example of MapReduce
This is a very simple example of MapReduce. No matter the amount of data you need to analyze, the key principles remain the same.
Assume you have five files, and each file contains two columns (a key and a value in Hadoop terms) that represent a city and the corresponding temperature recorded in that city for the various measurement days. The city is the key, and the temperature is the value. For example: (Toronto, 20). Out of all the data we have collected, you want to find the maximum temperature for each city across the data files (note that each file might have the same city represented multiple times).
Using the MapReduce framework, you can break this down into five map tasks, where each mapper works on one of the five files. The mapper task goes through the data and returns the maximum temperature for each city.
For example, the results produced from one mapper task for the data above would look like this: (Toronto, 20) (Whitby, 25) (New York, 22) (Rome, 33)
Assume the other four mapper tasks (working on the other four files not shown here) produced the following intermediate results:
(Toronto, 18) (Whitby, 27) (New York, 32) (Rome, 37) (Toronto, 32) (Whitby, 20) (New York, 33) (Rome, 38) (Toronto, 22) (Whitby, 19) (New York, 20) (Rome, 31) (Toronto, 31) (Whitby, 22) (New York, 19) (Rome, 30)
All five of these output streams would be fed into the reduce tasks, which combine the input results and output a single value for each city, producing a final result set as follows: (Toronto, 32) (Whitby, 27) (New York, 33) (Rome, 38).
As an analogy, you can think of map and reduce tasks as the way a census was conducted in Roman times, where the census bureau would dispatch its people to each city in the empire. Each census taker in each city would be tasked to count the number of people in that city and then return their results to the capital city. There, the results from each city would be reduced to a single count (sum of all cities) to determine the overall population of the empire. This mapping of people to cities, in parallel, and then combining the results (reducing) is much more efficient than sending a single person to count every person in the empire in a serial fashion.
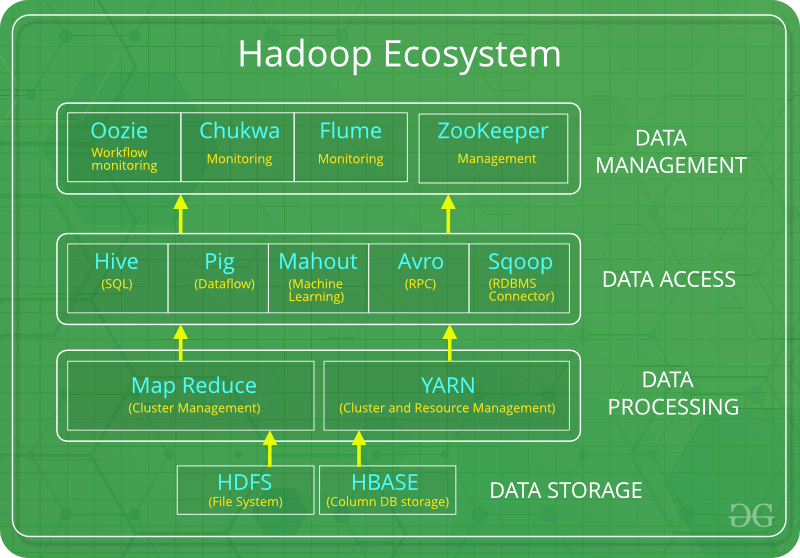
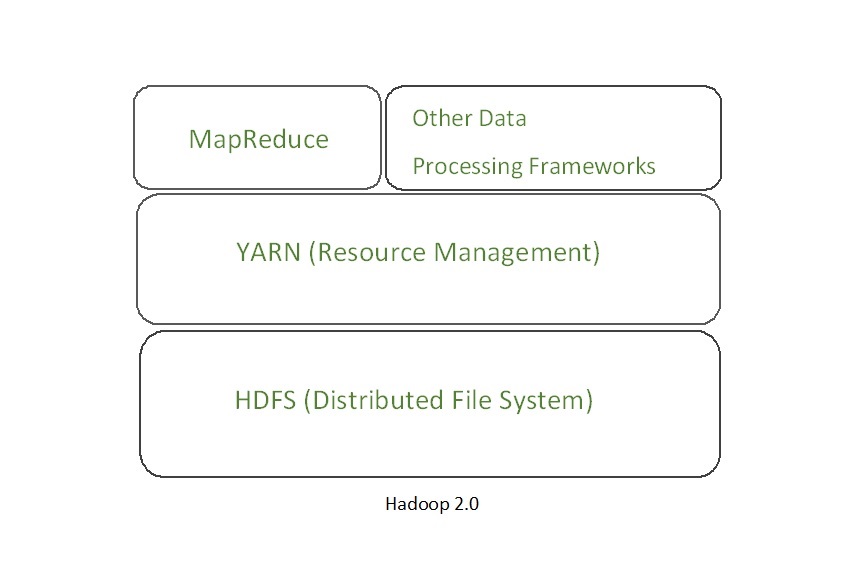
Hadoop Ecosystem
Hadoop Ecosystem is a platform or a suite which provides various services to solve the big data problems. It includes Apache projects and various commercial tools and solutions. There are four major elements of Hadoop i.e. HDFS, MapReduce, YARN, and Hadoop Common. Most of the tools or solutions are used to supplement or support these major elements. All these tools work collectively to provide services such as absorption, analysis, storage and maintenance of data etc.
Following are the components that collectively form a Hadoop ecosystem:
- HDFS: Hadoop Distributed File System
- YARN: Yet Another Resource Negotiator
- MapReduce: Programming based Data Processing
- Spark: In-Memory data processing
- PIG, HIVE: Query based processing of data services
- HBase: NoSQL Database
- Mahout, Spark MLLib: Machine Learning algorithm libraries
- Solar, Lucene: Searching and Indexing
- Zookeeper: Managing cluster
- Oozie: Job Scheduling
Note: Apart from the above-mentioned components, there are many other components too that are part of the Hadoop ecosystem.
All these toolkits or components revolve around one term i.e. Data. That’s the beauty of Hadoop that it revolves around data and hence making its synthesis easier.
HDFS:
- HDFS is the primary or major component of Hadoop ecosystem and is responsible for storing large data sets of structured or unstructured data across various nodes and thereby maintaining the metadata in the form of log files.
- HDFS consists of two core components i.e.
- Name node
- Data Node
- Name Node is the prime node which contains metadata (data about data) requiring comparatively fewer resources than the data nodes that stores the actual data. These data nodes are commodity hardware in the distributed environment. Undoubtedly, making Hadoop cost effective.
- HDFS maintains all the coordination between the clusters and hardware, thus working at the heart of the system.
YARN:
- Yet Another Resource Negotiator, as the name implies, YARN is the one who helps to manage the resources across the clusters. In short, it performs scheduling and resource allocation for the Hadoop System.
- Consists of three major components i.e.
- Resource Manager
- Nodes Manager
- Application Manager
- Resource manager has the privilege of allocating resources for the applications in a system whereas Node managers work on the allocation of resources such as CPU, memory, bandwidth per machine and later on acknowledges the resource manager. Application manager works as an interface between the resource manager and node manager and performs negotiations as per the requirement of the two.
MapReduce:
- By making the use of distributed and parallel algorithms, MapReduce makes it possible to carry over the processing’s logic and helps to write applications which transform big data sets into a manageable one.
- MapReduce makes the use of two functions i.e. Map() and Reduce() whose task is:
- Map() performs sorting and filtering of data and thereby organizing them in the form of group. Map generates a key-value pair based result which is later on processed by the Reduce() method.
- Reduce(), as the name suggests does the summarization by aggregating the mapped data. In simple, Reduce() takes the output generated by Map() as input and combines those tuples into smaller set of tuples.
PIG:
Pig was basically developed by Yahoo which works on a pig Latin language, which is Query based language similar to SQL.
- It is a platform for structuring the data flow, processing and analyzing huge data sets.
- Pig does the work of executing commands and in the background, all the activities of MapReduce are taken care of. After the processing, pig stores the result in HDFS.
- Pig Latin language is specially designed for this framework which runs on Pig Runtime. Just the way Java runs on the JVM.
- Pig helps to achieve ease of programming and optimization and hence is a major segment of the Hadoop Ecosystem.
HIVE:
- With the help of SQL methodology and interface, HIVE performs reading and writing of large data sets. However, its query language is called as HQL (Hive Query Language).
- It is highly scalable as it allows real-time processing and batch processing both. Also, all the SQL datatypes are supported by Hive thus, making the query processing easier.
- Similar to the Query Processing frameworks, HIVE too comes with two components: JDBC Drivers and HIVE Command Line.
- JDBC, along with ODBC drivers work on establishing the data storage permissions and connection whereas HIVE Command line helps in the processing of queries.
Mahout:
- Mahout, allows Machine Learnability to a system or application. Machine Learning, as the name suggests helps the system to develop itself based on some patterns, user/environmental interaction or on the basis of algorithms.
- It provides various libraries or functionalities such as collaborative filtering, clustering, and classification which are nothing but concepts of Machine learning. It allows invoking algorithms as per our need with the help of its own libraries.
Apache Spark:
- It’s a platform that handles all the process consumptive tasks like batch processing, interactive or iterative real-time processing, graph conversions, and visualization, etc.
- It consumes in memory resources hence, thus being faster than the prior in terms of optimization.
- Spark is best suited for real-time data whereas Hadoop is best suited for structured data or batch processing, hence both are used in most of the companies interchangeably.
Apache HBase:
- It’s a NoSQL database which supports all kinds of data and thus capable of handling anything of Hadoop Database. It provides capabilities of Google’s BigTable, thus able to work on Big Data sets effectively.
- At times where we need to search or retrieve the occurrences of something small in a huge database, the request must be processed within a short quick span of time. At such times, HBase comes handy as it gives us a tolerant way of storing limited data
Other Components: Apart from all of these, there are some other components too that carry out a huge task in order to make Hadoop capable of processing large datasets. They are as follows:
- Solr, Lucene: These are the two services that perform the task of searching and indexing with the help of some java libraries, especially Lucene is based on Java which allows spell check mechanism, as well. However, Lucene is driven by Solr.
- Zookeeper: There was a huge issue of management of coordination and synchronization among the resources or the components of Hadoop which resulted in inconsistency, often. Zookeeper overcame all the problems by performing synchronization, inter-component based communication, grouping, and maintenance.
- Oozie: Oozie simply performs the task of a scheduler, thus scheduling jobs and binding them together as a single unit. There is two kinds of jobs .i.e Oozie workflow and Oozie coordinator jobs. Oozie workflow is the jobs that need to be executed in a sequentially ordered manner whereas Oozie Coordinator jobs are those that are triggered when some data or external stimulus is given to it.
YARN
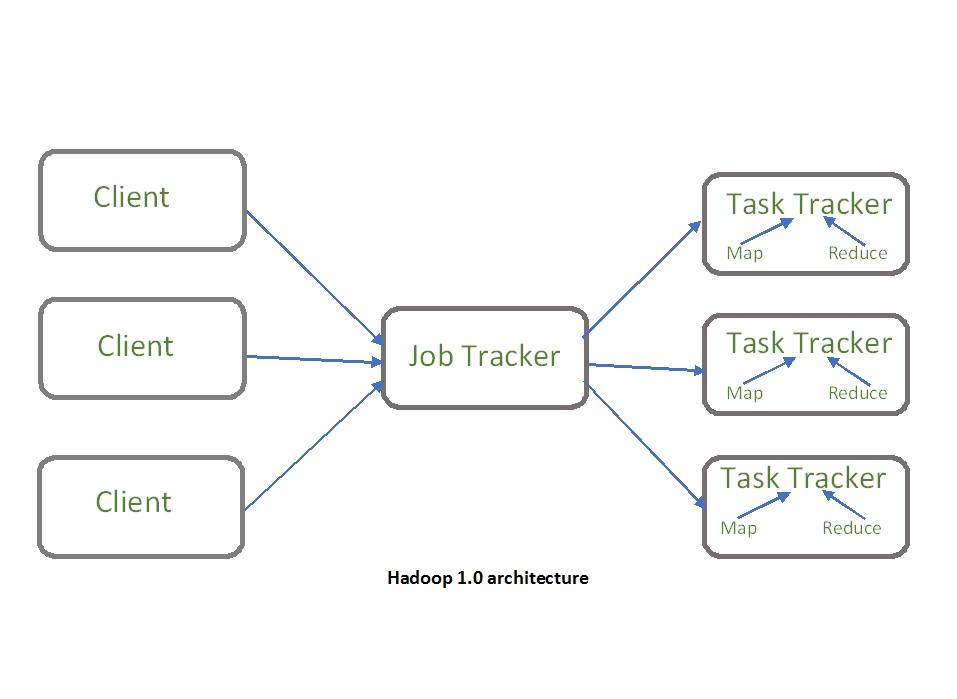
YARN stands for “Yet Another Resource Negotiator“. It was introduced in Hadoop 2.0 to remove the bottleneck on Job Tracker which was present in Hadoop 1.0. YARN was described as a “Redesigned Resource Manager” at the time of its launching, but it has now evolved to be known as large-scale distributed operating system used for Big Data processing.
YARN architecture basically separates resource management layer from the processing layer. In Hadoop 1.0 version, the responsibility of Job tracker is split between the resource manager and application manager.
YARN also allows different data processing engines like graph processing, interactive processing, stream processing as well as batch processing to run and process data stored in HDFS (Hadoop Distributed File System) thus making the system much more efficient. Through its various components, it can dynamically allocate various resources and schedule the application processing. For large volume data processing, it is quite necessary to manage the available resources properly so that every application can leverage them.
YARN Features: YARN gained popularity because of the following features-
- Scalability: The scheduler in Resource manager of YARN architecture allows Hadoop to extend and manage thousands of nodes and clusters.
- Compatibility: YARN supports the existing map-reduce applications without disruptions thus making it compatible with Hadoop 1.0 as well.
- Cluster Utilization:Since YARN supports Dynamic utilization of cluster in Hadoop, which enables optimized Cluster Utilization.
- Multi-tenancy: It allows multiple engine access thus giving organizations a benefit of multi-tenancy.
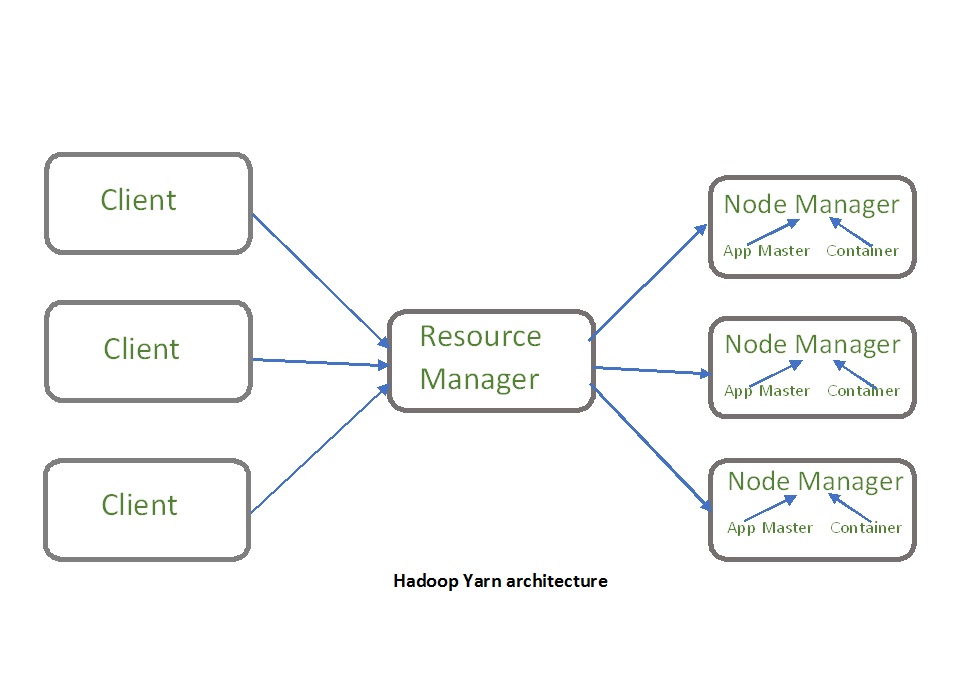
Hadoop YARN Architecture
The main components of YARN architecture include:
- Client: It submits map-reduce jobs.
- Resource Manager: It is the master daemon of YARN and is responsible for resource assignment and management among all the applications. Whenever it receives a processing request, it forwards it to the corresponding node manager and allocates resources for the completion of the request accordingly. It has two major components:
- Scheduler: It performs scheduling based on the allocated application and available resources. It is a pure scheduler, means it does not perform other tasks such as monitoring or tracking and does not guarantee a restart if a task fails. The YARN scheduler supports plugins such as Capacity Scheduler and Fair Scheduler to partition the cluster resources.
- Application manager: It is responsible for accepting the application and negotiating the first container from the resource manager. It also restarts the Application Master container if a task fails.
- Node Manager: It take care of individual node on Hadoop cluster and manages application and workflow and that particular node. Its primary job is to keep-up with the Resource Manager. It registers with the Resource Manager and sends heartbeats with the health status of the node. It monitors resource usage, performs log management and also kills a container based on directions from the resource manager. It is also responsible for creating the container process and start it on the request of Application master.
- Application Master: An application is a single job submitted to a framework. The application master is responsible for negotiating resources with the resource manager, tracking the status and monitoring progress of a single application. The application master requests the container from the node manager by sending a Container Launch Context(CLC) which includes everything an application needs to run. Once the application is started, it sends the health report to the resource manager from time-to-time.
- Container: It is a collection of physical resources such as RAM, CPU cores and disk on a single node. The containers are invoked by Container Launch Context(CLC) which is a record that contains information such as environment variables, security tokens, dependencies etc.
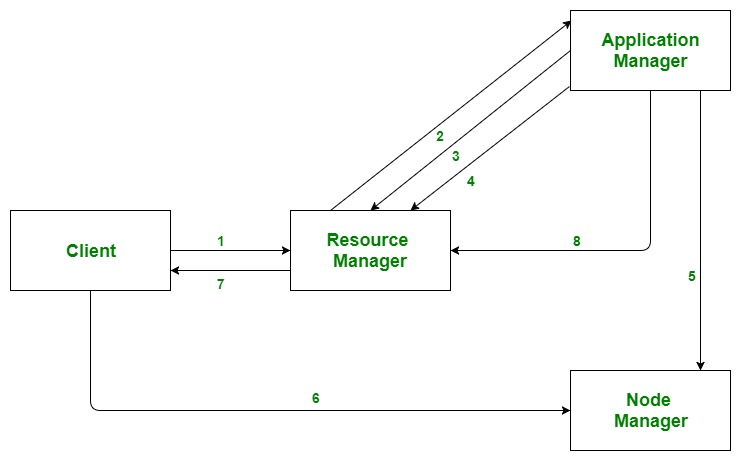
Application workflow in Hadoop YARN:
- Client submits an application
- The Resource Manager allocates a container to start the Application Manager
- The Application Manager registers itself with the Resource Manager
- The Application Manager negotiates containers from the Resource Manager
- The Application Manager notifies the Node Manager to launch containers
- Application code is executed in the container
- Client contacts Resource Manager/Application Manager to monitor application’s status
- Once the processing is complete, the Application Manager un-registers with the Resource Manager
Mahout
We are living in a day and age where information is available in abundance. The information overload has scaled to such heights that sometimes it becomes difficult to manage our little mailboxes! Imagine the volume of data and records some of the popular websites (the likes of Facebook, Twitter, and Youtube) have to collect and manage on a daily basis. It is not uncommon even for lesser known websites to receive huge amounts of information in bulk.
Normally we fall back on data mining algorithms to analyze bulk data to identify trends and draw conclusions. However, no data mining algorithm can be efficient enough to process very large datasets and provide outcomes in quick time, unless the computational tasks are run on multiple machines distributed over the cloud.
We now have new frameworks that allow us to break down a computation task into multiple segments and run each segment on a different machine. Mahout is such a data mining framework that normally runs coupled with the Hadoop infrastructure at its background to manage huge volumes of data.
What is Apache Mahout?
A mahout is one who drives an elephant as its master. The name comes from its close association with Apache Hadoop which uses an elephant as its logo.
Hadoop is an open-source framework from Apache that allows to store and process big data in a distributed environment across clusters of computers using simple programming models.
Apache Mahout is an open source project that is primarily used for creating scalable machine learning algorithms. It implements popular machine learning techniques such as:
- Recommendation
- Classification
- Clustering
Apache Mahout started as a sub-project of Apache’s Lucene in 2008. In 2010, Mahout became a top level project of Apache.
Features of Mahout
The primitive features of Apache Mahout are listed below.
The algorithms of Mahout are written on top of Hadoop, so it works well in distributed environment. Mahout uses the Apache Hadoop library to scale effectively in the cloud.
Mahout offers the coder a ready-to-use framework for doing data mining tasks on large volumes of data.
Mahout lets applications to analyze large sets of data effectively and in quick time.
Includes several MapReduce enabled clustering implementations such as k-means, fuzzy k-means, Canopy, Dirichlet, and Mean-Shift.
Supports Distributed Naive Bayes and Complementary Naive Bayes classification implementations.
Comes with distributed fitness function capabilities for evolutionary programming.
Includes matrix and vector libraries.
Applications of Mahout
Companies such as Adobe, Facebook, LinkedIn, Foursquare, Twitter, and Yahoo use Mahout internally.
Foursquare helps you in finding out places, food, and entertainment available in a particular area. It uses the recommender engine of Mahout.
Twitter uses Mahout for user interest modelling.
Yahoo! uses Mahout for pattern mining.
- VIDEO:
- https://drive.google.com/file/d/1_wgWfd0KcR7wzCpmJ40ty3z2xpvRkivl/view?usp=sharing
Comments
Post a Comment